Showing posts with label statistics. Show all posts

Monday, February 2, 2015

Pandemic: The Cure - standard deviation and probability

Initial setup
Recently we have been playing Pandemic: The Cure. The goal of the game is (loosely) to cure all the diseases. Each player has a certain number of dice that they roll on their turn (5 for most players, 7 if you're the Generalist) that give them their possible actions for the turn. One of the actions lets you use one of your die to "bottle up" a disease die and at the end of your turn you roll your bottled up disease dice and if the total amount rolled on the dice for a particular color of disease is greater than 13, then you have cured that disease.

Bottling up the diseases is great because it removes that disease die from play and helps you discover the cure, but until you discover the cure that die of yours you used to "bottle" it up is locked up and you can't use it, meaning you'll have fewer possible actions on your turn, making you less effective until the cure is discovered.

Disease Dice
Each color of disease die has different face values from the other colors'. Each one has a "Cross" face (value 0) and 5 other values. The average value of the faces on each die is 3 but since the values are different the standard deviations of the values on the dice are different. The values on the faces of the dice are as follows.

ValueBlackYellowBlueRed
1st0000
2nd3211
3rd3221
4th3434
5th4566
6th5566
Avg3333
Std Dev1.6722.532.68

So in terms of trying to cure the diseases, the likelihood that the total of the values across all the dice you roll of a color will meet the required sum is different. Below is a table of probabilities of curing the disease with various numbers of a color of dice. The amount needed to cure a disease is normally 13, but sometimes can be 11.

BlackYellowBlueRed
# Dice11+13+11+P13+11+13+11+13+
20.00%0.00%0.00%0.00%11.11%0.00%11.11%0.00%
332.87%7.41%34.72%12.04%34.26%20.37%40.28%23.15%
470.14%46.91%67.67%45.76%60.88%45.06%62.73%45.76%
589.51%77.22%86.52%73.53%79.90%67.30%78.29%67.36%
696.81%91.85%95.03%88.94%90.71%82.81%88.70%82.04%
799.12%97.42%98.33%95.86%96.05%91.82%94.62%90.59%

You'll see that for certain numbers of dice and goal numbers to reach, the probability of curing the disease can be quite different. For example, with 3 dice and a goal of 13 the probabilities range from 7.41% to 23.15%. Most differences are <10%, but that can be a fairly significant difference.

You'll see that no die is universally easier or harder to find cures with. Getting 13+ is only really possible once you have 4 dice. A goal of 11 isn't very likely until you have at least 3 dice, and even then the odds are very bad. It's very hard for a single character other than maybe the generalist to amass 4 or more dice by themselves. After you have 3 dice bottled up you only have two dice left. So getting the 1 in 6 result of being able to bottle up on your dice when you only have two dice is fairly unlikely. The game allows you to trade your bottled up dice to another player if you're on the same square. This probability table tells me that that's a very important part of the game.

Advanced discussion:
In the above two tables, I ordered the dice colors by their standard deviations, lower on the left and higher on the right. One thing you might notice is that for 3 dice, the higher variance dice (aka higher standard deviation) have a higher probability of success. You'll notice that for higher numbers of dice, the colors with a lower standard deviation tend to have a higher chance of success.

When you have 3 dice, the average value of the sum is 9 (because the average for any given die is 3). Nine is insufficient for either goal so results near the average are bad. So you want a result that's far from the average, meaning you want a higher standard deviation. When you're at 5+ dice, the average result, 15, is above the goal so lower standard deviations are better.

When average is bad and you want that extreme result, you'll do better with a higher standard deviation. When the average is good and you don't need an extreme result, you'll do better with a lower standard deviation.

Player Dice, showing all faces
Epidemic Roll Change
Another place where probability plays a big role (roll?) is with epidemics. Each character die has one face which, when rolled, will advance the epidemic track. The generalist, with their seven dice instead of the normal 5, stands a much greater chance of rolling these values on their turn. To balance this, the generalist is allowed to ignore the effect of the first epidemic they roll each turn. This has a huge effect, and it makes the generalist have an overall lower change of advancing the epidemic track than other characters. Below is a table of probabilities for how far each character will advance the epidemic track on their initial roll of dice (with full dice i.e. no dice locked up from bottling up diseases).

AdvancementNormalGeneralist
040.19%66.98%
140.19%23.44%
216.08%7.81%
33.22%1.56%
40.32%0.19%
50.01%0.01%
6NA0.0004%
Avg0.830.45

The other advantage of being the generalist is that when you have no epidemics on your initial roll (28% of the time w/ 7 dice, higher w/ fewer) you can freely reroll dice to try and get a better result w/ no fear of the consequences of rolling an epidemic.

Friday, June 7, 2013

Your ideas about WoW players are wrong - engagement bias

Not that kind of engagement
The people you see when you log into WoW, no matter which server you play on, do not comprise a representative sample of the people who play WoW. 

That sentence might seem a bit surprising but I can assure you that it's 100% true. The primary culprit here is engagement bias, which is something you have to consider when you're analyzing a game-as-a-service, like WoW. Suppose 7 million people play WoW in a given week. Let's look at them by how engaged they hypothetically are (as measured by how many days they played that week).

EngagementPlayer Count% played today# played today% DAU in bucket
1 Days1,000,00014.29%142,8573.57%
2 Days1,000,00028.57%285,7147.14%
3 Days1,000,00042.86%428,57110.71%
4 Days1,000,00057.14%571,42914.29%
5 Days1,000,00071.43%714,28617.86%
6 Days1,000,00085.71%857,14321.43%
7 Days1,000,000100%1,000,00025%

Here we see that if you look at the people who play on a particular day (DAU - Daily Active User), there is a distinct bias towards users who have a higher weekly engagement. Side note: players who play in a given week are called WAU. Even though the WAU are evenly distributed among the engagement buckets, the DAU are heavily skewed towards the highly engaged. Then again, WAU isn't how Blizzard likely defines 'player' for WoW, they likely use subscribers as the definition of the player, since that's how they get their money and the $15 a low-engaged player gives them is the same as the $15 a heroic raider sends them.

What this means is that the people that you see every day in the game aren't really a good representation of WoW's subscriber base. People aren't as engaged with the game as they appear to be. From a development and design standpoint, the highly-engaged users are the least likely to let their subscription lapse, so features are often made to appeal to the casual crowd/make casual players more engaged. If you look at the history of WoW this is what you'll see. Even heroic raiding was oriented around this because it allowed them to make regular raiding easier and more accessible to the casual player.

This is just one example of engagement bias, which is a recurring problem in user-centric data analysis and therefore is a recurring problem in the games-as-a-service industry. Engagement bias is the phenomenon that more active users are often more likely to be counter/sampled.

Back when I was working on analyzing the results of my 2011 WoW Survey, one question I wanted to answer was "What are the correlations between classes?" meaning that I wanted to know which classes a player was more or less likely to play if they played another class. For example, "Are people who play Warlocks more or less likely to play a Death Knight than someone who plays a Rogue?"

Suppose that the average respondent to my survey listed two different classes among the ones that they play. At the time, this means that roughly 20% of respondents played any particular class (class representation actually varied wildly). When I pulled the percent of Warlock players that ALSO played Paladins I found a much higher number, 40% or greater. This baffled me for a long time. For each combination of classes, this same thing happened, the percentage of X players that also played Y was higher than the percent of the general population that played class Y.

Why was this?

Among the people that I surveyed, they varied widely among the number of characters they played. Some people only listed 1 or 2 characters, some listed 10 or more. When I selected all the players who played a Warlock, the highly-engaged players (those with more characters) were more likely to be in that group than the low-engaged players (those with few characters). So the group of Warlock players had, on average, more characters than the general population. So when I calculated how many of them also played Paladins, I received a much higher number than with the general population.

Of course, there was something else that would skew the results of my analysis. I got my data not via the actual numbers but by getting survey results that mainly came from MMO-Champion. Since these are people that are participating in the WoW community, they are going to tend to be more engaged than the general WoW playing population.

Engagement bias is just one of the many things you have to keep in mind when you're analyzing game players. For example, during my WoW survey, I also found that MMO-Champion users tend to skew more male than respondents from other sources that I've used. For this reason and more when I was doing my analysis I was careful to make sure to state that the numbers were not to be taken as absolute facts, but as being "directional", meaning that it'll likely indicate what the differences between two groups or what may be more or less popular for a group even if the exact values aren't true for the overall population.

This is just one of the slew of problems that you run into when doing user-facing data analysis, something which I'll be covering in a later post.

Thursday, July 26, 2012

Risk Battle Statistics and Simulator

Number of Attackers: Offensive Airfield
Number of Defenders: Defensive Airfield

Offense Rolls:
Defense Rolls:
Offense Wins:
Defense Wins:
Cumulative Offense Wins: 0
Cumulative Defense Wins: 0
Offensive Kill-Death Ratio: NA


I was trying to find an image to put above and then I had the bright idea to code the above simulator. After an embarrassingly long amount of time due to my Javascript inexperience, it is done. An explanation of how battle works in Risk is at the bottom following the *

A long time ago I wrote a post that contained some probability calculations associated with the popular board game Risk. This was long before I knew how to format things nicely on the internet and before I was aware of some other things. That said, I think that I can approach the content and its presentation much better now than I could then so I've redone the post.

The original post was focused on showing that you should always choose to attack and defend with as many units as you can, that the odds work out best for you that way. This means that the offense should always attack with 3 if possible and the defense should always defend with 2.

It turns out that the latest version of the Risk rules (which are the rules used in Risk: Factions, a downloadable title for the PS3 and XBox 360) can have situations which modify your battles. Fulfilling certain objectives can allow a player to attack with up to 4 soldiers or defend with up to 3. Furthermore, the player can obtain an airport which bestow a +1 bonus to that player's highest die roll when attacking or defending for any battle that takes place on or adjacent to the territory which has the airport.

I decided that I wanted to see how these variables affect the probabilities of success and the kill-death ratio for the offense. To quickly explain the data in the chart:
  • Most entries fall under "X Kills" which is the probability that under those circumstance the offense will kill X of the defender's pieces. Remember that if the offense doesn't kill a defender's piece then the defender kills a piece belonging to the offense.
  • KDR stands for Kill-to-Death Ratio and is how many pieces the offense should expect to kill for every piece they expect to lose. For example, in the 3 vs 2 matchup with an airport for the offense, the offense should expect to kill almost 2 of the defender's pieces for each piece they lose. A KDR>1 is good for the offense. A KDR<1 is good for the defense.

Probability of offense winning X rolls and KDR
3 vs 2
2 Kills1 Kill0 KillsKDR
Normal37%34%29%1.17
Off +151%31%18%1.97
Def +124%41%35%0.80
3 vs 3
3 Kills2 Kills1 Kill0 KillsKDR
Normal14%21%26%38%0.58
Off +120%25%31%24%0.88
Def +18%21%27%45%0.44
4 vs 2
2 Kills1 Kill0 KillsKDR
Normal46%33%21%1.67
Off +163%25%12%3.11
Def +130%45%25%1.09
4 vs 3
3 Kills2 Kills1 Kill0 KillsKDR
Normal25%26%25%24%1.03
Off +137%25%24%14%1.61
Def +114%31%27%28%0.78

There's nothing surprising here, but it is very interesting to see how much of an advantage the offense has in the normal situation and how much that advantage changes depending on various conditions. There is another advantage that the offense has that isn't discussed here. The offense gets to choose when and where they attack, which allows the to pick battles that they are fairly certain they can win. Play wisely, everyone.

*In classic Risk the objective is to conquer all the territory on the map. You do this by engaging your enemies in battle. To do this you select up to three units on a territory you control to attack an adjacent territory. The owner of that territory can defend with up to two units (these numbers can be increased under certain conditions)

Each player rolls a die for each unit they are attack/defending with and sorts them from highest to lowest. The compare matching dice and if the offense's roll is higher than the defense's the defense loses a piece. If the defense's is higher or there is a tie, then the offense loses a piece. This repeats until the defender loses all their pieces on the territory or the offense gives up.

Example: The offense attacks with 3 pieces and the defense defends with 2. Their rolls are
  • Offense: 4 6 2
  • Defense: 5 4
Sorted, the offense has 6, 4 and 2 and the defense has 5 and 4. The offense's 6 beats the defense's matching 5 but the defense's 4 beats the offense's matching 4 since the defense wins ties. Both sides lose a piece. The 2 is ignored.

Wednesday, May 30, 2012

WoW: MoP Drop Rate Statistics Calculators

Normal Loot

Drop Rate
Number of Kills
Probability of drop =
Probability
Kills Needed =
Average Next Drop Prob Median
??? ??? ≤???

LFR Drops

Drops per boss
Pieces eligible
Pieces Needed
Average Next Drop Prob Median
??? ??? ≤???

Explanation of the Normal Loot section
First, you'll have to enter in the drop rate. From that, the table below will populate. It will tell you the average number of kills needed for the piece to drop, the probability that it will drop on the next kill (which should be equivalent to the entered probability) and the median number of kills required to see the item drop. If, for example the median number of kills is 4, then there is a 50% or better chance it will have dropped on or before the fourth kill.

Second, if you enter in the number of kills that you've performed, then it will tell you the probability that the item should have dropped at least once in those kills. If you enter in something in the "Probability" field, it will tell you the number of kills needed to have that probability of the item dropping at least once.

For example, if you have a drop rate of .5 and 5 kills, there is a 0.968 (actually 0.9875, but the results are rounded) probability that the item will drop at least once in those five kills. If the drop rate is still 0.5 and you enter a probability of .90, it tell you that 4 kills are necessary to have a 90% or better chance of the item having dropped at least once.

Explanation of the LFR Drops section
This is based on the LFR loot system that will be introduced in Mists of Pandaria. An explanation can be found here. You just enter in how many piece of loot the boss will drop among the raid, how many pieces of loot in its table you are eligible for, and how many of those pieces you actually want. When you have that entered the table will populate with the same type of information that is in the above table.

I based this on the assumption that a boss will drop a particular number of pieces. If it is the case that you have a fixed X% chance to win loot, then I will alter it. It is also based on a 25 player group. Furthermore, the top section is about a piece dropping and not necessarily that you'll win it. The bottom section involves you winning a piece that you want.

If you have any questions about this or about loot drops, please don't hesitate to ask below. If you have comments, recommendations or requests, then please ask.

Tuesday, May 29, 2012

The Myth of Compound Interest


Banks and mathematics courses will talk about how monthly compounded interested is better than yearly compounded interest. You might even see a demonstration of it such as this one dealing with 6% yearly interest.

Which shows that a 6% interest rate, when compounded monthly, provides a slightly higher amount of interest. Now, the amount of increase you get is dependent on your base interest rate. In our example, a 6% interest rate becomes a ~6.17% interest rate. A 12% yearly interest rate becomes a ~12.68% interest rate, which is a far better gain than what 6% achieves. But a 12% interest rate is incredibly unlikely to get anywhere.

So why am I calling this a myth? Well, because it's only better than yearly interest under certain conditions. The example they give you presumes that you aren't depositing or withdrawing money from the account. And if you're not depositing or withdrawing money from an account, what good is it? It's either a small amount of money, in which case the additional interest in negligible. If it's a large amount of money, then the person is likely financially secure or wealthy, so they could benefit significantly from the increased interest.

Suppose you're depositing money into the account every month. If you have monthly interest, then a small amount of interest is applied to small amounts of money at the beginning of the year, and larger amounts of money at the end of the year. If, however, you have yearly interest, all of the interest is applied to a large sum of money at the end of the year. Why apply interest to a small amount of money when you could instead have the interest applied to a large amount of money?

The question then becomes, how big of a deal is this discrepancy? Well, I'm glad you asked. I used an R program to come up with some numbers for us. I used a 6% yearly interest rate and invested in the account at $300 per month. Now, the $300 figure isn't important, these results will hold true no matter what the amount is, $300 just seemed like a good figure to work with.

YearsNo InterestMonthlyYearlyDifference
1$3,600$3,719.17$3,816.00$96.83
2$7,200$7,667.73$7,860.96$193.23
3$10,800$11,859.80$12,148.60$288.80
4$14,400$16,310.50$16,693.50$383.00
5$18,000$21,035.70$21,511.10$475.40

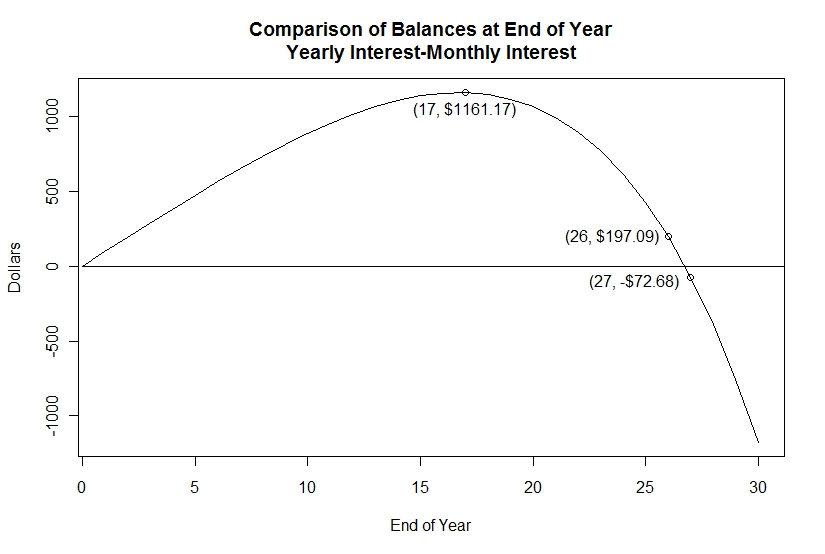
From this, it would appear that the yearly interest is always better than monthly interest, but when you carry the calculations out you find that monthly interest will eventually exceed yearly interest.
Click to Enlarge
From this chart, if you have a 6% interest rate and deposit money at a constant rate, then monthly interest overtakes yearly interest at the end of the year only at year 27. Monthly interest accounts exceed yearly interest accounts in the middle of each year because of the interest that is applied during the year, but at the end of each year prior to year 27, yearly interest comes back. From this graph we see that yearly interest provides, at most, a $1161.17 advantage (with a $0 initial balance and monthly deposits of $300). This scales as long as your monthly deposit is the same. So the advantage maxes out at roughly four times your monthly deposit.

There is another situation where compound interest is better. When the amount of money in an account is in decline, it is better to have compound interest because then the interest will be applied when you have more money (before you lose said money).

So what affects whether monthly or yearly interest is better? The factors are your initial balance and how much you invest each month. If you have a high initial balance, then monthly interest should always be better. If you have little to no initial balance, yearly interest will be better for a long time. If your investment rate increases with time, such as starting by depositing $100 and depositing more and more as time goes on, then yearly interest will stay relevant longer.

So banks tell you about this wonderful thing known as compound interest when it isn't necessarily better for you. I know how you all must feel right now. I mean, how could the banks betray you like this? It's just so hard to believe that they could be like that. I mean, that something they would tell you is a good thing can actually be a bad thing (unless you are financially secure enough to save a large amount of money for a long time.

I think I'll do a followup post that investigates some other investment situations. Keep an eye out for that. 

Tuesday, March 13, 2012

Night School: The Math of Drop Rates

Hopefully that chestpiece is in this pile somewhere...
Drop rates are where most people will encounter and be aware of randomness in World of Warcraft. The other places would be in crits and random procs, of course. There can also be quite a bit of misunderstanding about how they work. Everybody knows the basics, of course: when the boss dies, the game rolls some random numbers and finds those numbers in the loot table to see what the boss should drop. Different items have different drop rates, which come from that item occupying a larger or smaller section of the loot table, making it more or less likely to drop. Other things, like tier tokens and legendary weapon fragments are often rolled for on separate tables from the normal loot.

For the duration of this post, I talk about drop rates with the percents, but all the math with be done with the decimal. So, 10% is 0.10, 5% is 0.05, and 100% is 1. Percents (Latin for "per 100") are a great way to talk about these things, but you cannot do the actual math with them, one must convert them to decimals.

How long until this item will drop?
That's the big question, isn't it. When will my shield drop? Why can't I get a shoulder token? Where is that stupid phoenix mount? Let's just assume that you're the only person contending for a particular item, and that when it drops it will go to you. Will you indulge me by allowing me a table? Who am I kidding? I'm putting a table here whether you like it or not.

Minimum Kills for X% of people?
Drop rate
% of players50%10%1%
50%2769
10%422230
1%744459

An entry from this chart should read as, "With a drop rate of 10%, 50% of players will have to kill the boss 7 or more tries."

So how do you like those numbers? That mount that has a 1% drop rate? There's a ~50% chance it will take you 68 or fewer tries. There's also a 10% chance it will take you 230 or more tries. You might notice that the numbers for 1% of players is roughly double that for the 10% of players. This is because 1% is 10% of 10%. But where does all this come from?

Suppose the probability that an item will drop is p, and the probability that it won't drop would then be 1-p. If you want to know the probability that something will drop after you've killed the boss x times, that's actually difficult to directly calculate, because it could drop multiple times. When calculating probabilities, you'll very often run into situations where the thing you want to know is hard to calculate directly, but the opposite of it (in this case, the probability that the item won't drop in x kills) is very easy to calculate. In that case you calculate the probability that it won't happen and then subtract the result from 1.

In our question, calculating the probability that something won't drop is easy. You simply take the probability that it won't drop from a single kill, 1-p, and raise it to the power of the number of kills, x. You multiply because these are independent events, meaning that the outcome of one event (a kill) does not affect the outcome of the other events. This makes the probability that the item won't drop is*
and the probability that it will drop at least once is
One thing that could be noticed from playing around with that equation is that, for any positive value of x,  unless p=0 or 1, the formula will never equal 0 or 1. In other words, the only times when there is absolute certainty is when the drop isn't random, or you haven't killed the boss yet. Here is a chart that depicts the probability that an item will have dropped based on how many kills have been attempted. Here, the probability of a drop is 10%.

Wolfram Alpha is a great source for doing math.** 
You'll notice that even at the number of kills get's very large, the probability that the item will have dropped never actually hits 1. So no matter how many times you kill, there's no guarantee that the item will drop.

There is an article written by Brian Wood on WoWInsider that contains a wonderful calculator for drop rate percentages such as this. I highly recommend that you check it out here.

Corollary: Average Number of Drops
Of course, the previous section is based on an assumption that you'll only want one of an item, and that it will only drop from one boss/monster. Say you are farming something that has a <100% chance of dropping from whatever you're killing. Let's say it's Relics of Ulduar. It has an 11% percent chance of dropping off of Mildred the Cruel If you want to know the average number that you should expect to get after so many kills, you just multiply the probability of it dropping by the number of kills. If you were to kill Mildred 26 times, then you should expect to have an average of .11*26=2.86 Relics of Ulduar.

The mousover text for those equations contains the LaTeX code used to produce them at the Online LaTeX Equation Editor. Note: "\left(" and "\right)" weren't actually necessary for those, I could have just used "(" and ")" but it's considered a best practice to use the longer ones because they scale in size with their contents. Consider the example below:


**I used Wolfram Alpha to produce the graph up above. It's an amazing thing. Like if Google could do your homework. It can factor polynomials, give population statistics, and even do calculus. I used the free trial of the pro service to get the graph above. The whole thing blows my damn mind.

Thursday, March 8, 2012

WoW Survey Results: behind the scenes of "crossplay"

I tend to round to two decimal places for all the stuff I do, just so you know. I like two decimal places because it's the same level of accuracy that you get with money; so it feels specific without being overly so.

During the writing of my post on crossplay, I encountered a problem. When I was looking at the difference in crossplay between the young and the old group, I wanted a way to talk about whether a particular increase for a race or class was more or less than the average increase. I've included a small sample of one of those tables below.

Crossplay by age for race
YoungerOlder
Average27.62%34.65%
Human31.28%41.51%
Troll16.67%26%
You'll notice that the last column has been removed also. That's because that's exactly what we're here to talk about. My first instinct for that last column, which I'll just refer to as the "change" column, was to just to take the difference. This would give us a difference of 10.23 for the humans and 9.33 for the trolls. I didn't like that, though, because I felt that the trolls' gain was more significant since they started off much lower than the humans.

My next instinct was to try ratios (division) for the last column. This would give the humans a result of 1.33, a ~33% increase, and the trolls a result of 1.56, a ~56% increase. While this looks good for these two numbers, I actually have conceptual problems with this as well. Suppose I included a third race here for which the young group had 90% female characters and 100% female characters for the older group. This would give us a result of 1.11 (repeating, of course). I feel that's too low though; going from having 10% male characters to zero is a pretty significant thing. So I wanted something that will scale well at the low end and at the high end. Just as gaining 10 percentage points is a big deal when you have very little, such as the trolls, it's also a big deal when there's not much left to pick from, such as for this hypothetical race.

So it occurred to me that just considering how many female characters there were would be insufficient, and that I would also need to look at how many male character there were. This is when I turned to looking at the odds. In short (if you don't want to read that link), the odds of something happening is the probability that it will happen divided by the probability it won't happen. So if the odds of something happening are 10:1, it's 10 times more likely to happen than to not happen. So I decided to look at the ratio of the odds for each age group, or as I summarized in the last post
where p is the percentage of female characters for that group. When I did all the calculations and thought about how I felt about the results, everything just looked right. The values that I felt should be bigger than others were all that way. 

So if you're wondering how this stuff get's done; that's how. It's trial, error, and intuition.

Wednesday, March 7, 2012

WoW Survey Results: Looking at crossplay

Actually a dude
There's a bit of an adage about World of Warcraft that the men are men, and so are the women. This is to say that no matter what the gender of the character you're looking at is, it's likely a guy playing that character. Now, given the percentage of female players that some studies have shown and the percent of the time that players of both genders play oppositely-gendered characters, this is actually unlikely.

For this article, and forever on until I manage to find a better one, I will use the term "crossplay" to refer to when a person plays a character whose gender is different from their gender.

In general, from my survey results, male respondents engaged in crossplay ~33.96% of the time and female respondents engaged in crossplay ~9.19% of the time. Right of the bat we see that men engage in crossplay far more than women do, almost 4 times as much. If you ask, most male players would likely tell you that you spend all of your time in this game looking at your character's butt and they would like to enjoy looking at what is presented to them.

Is that all there is too it? Guys, why do (or don't) you play female characters? Ladies, why do (or don't) you play male characters? Well, we can look at this ourselves a bit while we wait for potentially helpful comments. Let's get some breakdowns in here. Unfortunately, as in the past, I can't supply a breakdown of crossplay for female respondents due to an insufficient volume of female respondents. I'm so totally bummed about that. So, if I fail to stipulate it later on, I'm just talking about crossplay by male players.

Percent of crossplay for male respondents for each class
PriestPaladinMageShamanRogueDruidHunterWarlockDeath KnightWarrior
49.2140.5738.6234.0432.8131.5329.8828.7827.5924.66

What immediately springs out for me is something that I've noticed before. We find the warlock, Death Knight and warrior are at the bottom of a list. We saw this before when I was looking at gender and class, when those were 3 of the 4 least played classes for female respondents. It's interesting that three of the four least played classes for female respondents are the least crossplayed classes for male respondents. Although pinpointing why it's this way will have the same troubles that we had back then. The correlations between armor type, role, location in battle, and theme will confuse the analysis. We also see that our light-wielders, the priest and the paladin, hold solid leads in the top spots with the cloth-wearing mage in the third spot. Let's look at this a few different ways.

Average crossplay by armor type
ClothLeatherMailPlate
38.8732.17
31.9530.94
This table shows a pretty clear trend that indicates that as you go from the lighter armor types to the heavier armor types, the average amount of crossplay by male respondents decreases. This probably plays into the aesthetics of the armor as many male players probably don't imagine a male hero wearing a robe or a female hero wearing bulky plate.

Average crossplay by role
No HealHeal
No Tank32.5241.61
Tank26.1336.05
This table show us that healers tend to have more crossplay while tanks tend to have less crossplay. Does this show that male players consider tanking to be a masculine role and healing to be a feminine role?

Average crossplay by fight location
MeleeMixRanged
28.3535.3736.62
Here we can see that male players tend to crossplay less with characters in melee and more with characters at range. I feel less certain that this one plays into real feelings and feel that it may just be a correlation with the effects of role and armor type.

The three tables above really break down what I think are some of the predominant factors that influence whether a male player will crossplay. I think that armor type and how it affects aesthetics and role/fighting location and how that affects perception really make up the most of it. I'll admit that I am not immune to this as well, but I'll get into that after this next section. Now let's look at how race influences crossplay.

Percent of crossplay for male respondents for each race
DraeneiNEBEHumanGnomeGoblinWorgenUndeadTrollDwarfOrcTauren
59.7052.8752.6040.6435.7731.3625.3322.9421.7214.8313.9212.80

There is some wide variance here, huh. Analyzing the races is different since they can't be broken into groups as easily as classes can be. The thing that tends to stick out to me, is the comparative of the female model, especially when that is compared to the male model. We see that the female models that are the most attractive (according to human standards, of course) are at the top of this list. I have complete faith that the patented female Draenei hip wiggle has played no small role in vaulting them to the front of this list. Gnomes, while certainly not having human proportions, are much like tiny humans, which is probably the factor that has placed them in the number 5 spot above all the "monstrous" races and the dwarves. Interestingly, although dwarves are quite human, moreso than the gnomes in my opinion, they are at tenth place here. I guess guys just tend to be too shallow for them. They probably couldn't handle a playing a dwarven lady anyway. One last table for this section, you probably noticed this yourself with the last one.

Crossplay by faction
AllianceHorde
38.19%25.89%

This combined with the fact that the Horde has fewer female players than the Alliance means that the Horde is a bit of a sausage fest, comparatively. Sorry Horde bros, that's just the way it is.
Also really a dude

In full disclosure I must admit that I am not immune to the draw of the female characters, although I believe my percentage is lower than the average. My very first female character was a Night Elf priest (how typical, right?) and my second female character is a human warrior, which I've talked about before (and need to play more). I honestly can't remember any others that I may have.

So it seems that the trends that drive men to play a female character are the oft-quoted attractiveness and their perception of in-game gender roles. What I'm particularly interested in is why there is such a difference in the percentage of crossplay between male and female players. Do women play so few male characters because female characters tend to be more attractive? What other components are there to this?

But wait, there's more - Age and crossplay
There is an age component to all of this, too. In general, older male players are more likely to play female characters than younger male players. Going back to the two groups that I set up for my post about the ages of male players and how that impacted what they played, I found that in general, the 18 and younger group played female characters 27.62% of the time while the 25 and older group played female characters 34.65% of the time. Futhermore, the increase from one group to another was not uniform, some groups saw a higher increase than others.

Crossplay by age for class
YoungerOlderComparison of odds*
Average27.62%34.65%1.39
Priest46.02%47.26%1.05
Mage37.27%37.24%1.00
Paladin35.33%42.71%1.36
Shaman30.08%32.88%1.14
Hunter27.27%25.51%0.91
Rogue23.85%26.84%1.17
Druid23.81%39.87%2.12
Warlock21.11%27.78%1.44
Death Knight17.65%27.75%1.79
Warrior15.15%25.48%1.91

So every group except for the hunter and the mage saw an increase in their amount of crossplay among the male respondents at they ageds. When looking at this chart, however, some of the classes increased less than the average increase. So while female characters tend to appeal more as we move from the younger group to the older group, some don't increase as much. In summary, as male players age
  • Decreased: hunter, mage
  • Increased<Average: priest, shaman, rogue, paladin
  • Increased>Average: warlock, Death Knight, warrior, druid
One thing to notice is that the classes that had the lowest percentage of female players among the younger group saw the biggest increases. It's distinctly possible that as male players get older, they tend to throw away a bit of their preconceived notions about in-game gender roles. This isn't to say that the older male players are an enlightened bunch, but just that they don't subscribe to those gender roles as strongly.

Crossplay by age for race
YoungerOlderComparison of odds*
Average27.62%34.65%1.39
Draenei58.75%53.7%0.81
Night Elf47.58%47.11%0.98
Blood Elf44.44%52.02%1.36
Human31.28%41.51%1.56
Goblin23.61%30.43%1.42
Gnome22.92%39.19%2.17
Dwarf18.18%13.25%0.69
Worgen17.65%30.84%2.08
Troll16.67%26%1.76
Undead15.79%29.27%2.21
Orc10.62%9.17%0.85
Tauren10.48%21.88%2.42

 In summary, this is
  • Decrease: dwarf, draenei, orc, Night Elf
  • Increase<Average:Blood Elf
  • Increase>Average:goblin, human, troll, worgen, gnome, undead, tauren
 One thing to notice here is that in addition to being more open to crossplay, the older male group also seems to have lost their qualms with the "monstrous" female races, with all of them except for the orc receiving significant gains in popularity. Quite frankly, I can't come up with a reason that the orc and the dwarf would have a decrease in popularity. It's puzzling to me.

I could have done the various breakdowns that I normally do but I think what we saw was pretty clear and that I would spare you all.   ;-)

Conclusion
Male crossplay is something that has many factors. In general, it seems to be affected by the attractiveness of the female model of the chosen race as well as the aesthetics of the class's armor. Futhermore, it seems to be affected by the in-game gender roles that the players seem to ascribe to their character's PVE roles.

As male players get older, things seem to change. They seem to become more willing to crossplay in general. It seems likely to me that this isn't due to an increased desire to play female characters but a loss of feeling that they have to play male characters. Furthermore, they seem to becomes more open in how they crossplay, not feeling as strong a pull to tend to those perceived in game gender roles and becoming more open to crossplaying with races that they might not find as attractive as others.

All in all, no matter how much analysis I do here, we can't conclude anything about why a particular person engages in crossplay or why they crossplay with the particular character(s) that they do. For some, it could just be about having something nice to look at. For some, it could be for roleplay purposes. For others, it can be part of their transition process as a transgendered person.

In the future, I'd like to be able to take a look at female crossplay. The fact that it is more rare makes the possibility of analyzing it all the more appealing. If I get the chance to do a study like this again in the future I will go to great steps to get a large enough number of female respondents so that I can achieve such an analysis.

Next time, I intend to look at what I'm calling "class correlations." I'll be looking at what classes tend to be played by the same person and how if one person plays one class, how likely is it that they play the other classes. Are there some classes that are much likelier to be played together than others? We'll find out.

*The comparison of odds column is calculated as follows. If p(young) is the percentage of female characters for the young group and p(old) being the same for the older group, with both being between 0 and 1, then the comparison of odds,
This is a measure of the increase in crossplay from the young group to the male group. It is the odds that a older respondent crossplays for that class divided by the odds that a younger respondent crossplays for that class.

Friday, February 24, 2012

WoW Survey Results: Age Differences


MAAATTTTHHHHH
We've already covered the topic of how the different gender's pick their characters, but what about people of different ages? The differences are more pronounced than I thought they would be. To do this part of the study, I split the male respondent base into three groups, each as close to one-third of the total as I could. The groups were those 18 and younger, those from 19 to 24, and those 25 and older. I took the young group and the older group and then I summarized and compared them. Each group consisted of over 400 respondents, with approximately the same number of respondents in each group.

Since there was a correlation between the age and gender of respondents, I separated the male and female respondents so I could analyze each independently. Unfortunately, I did not have enough female respondents to split them into groups for a similar age analysis. I really wish I did. I intend on doing another survey in the future and I relly hope that I can not only have a more robust form, but that it will get a much better spread through the community.

Average Class Representation
ClassDeath KnightDruidHunterMagePaladinPriestRogueShamanWarlockWarrior
Younger10.95%11.84%10.63%8.86%12.08%9.1%8.78%9.9%7.25%10.63%
Older10.57%10.78%9.89%9.89%13.1%9.96%7.78%9.96%7.37%10.71%
Difference-0.38%-1.06%-0.74%+1.03%+1.02%+.86%-1.0%+0.06%+0.12%+0.08%

The classes that increased in representation as you go from the younger respondents to the older respondents were the mage, paladin, and priest primarily with the shaman, warlock and warrior receiving minor increases. The classes that decreased in representation were the Death Knight, druid, hunter, and rogue. I personally don't see any particular trend in the data. There is a decrease in the leather and mail wearers and an increase in the cloth and plate wearers as you go from the younger to the older respondents. When I tracked the preferences of the two age groups by role, the changes were incredibly small. Then I looked at things with respect to the class's location when fighting.

Average Representation by Location

YoungerOlder
Melee10.12%9.69%
Mix11.27%11.28%
Ranged8.96%9.28%

Here we see a decrease in melee-only classes and an increase in ranged-only classes, with the classes that do both remaining about the same. Is it possible that young men just feel a stronger need to hit things with weapons, and that drives them towards warriors, Death Knights, and rogues? I feel that's distinctly the case. Now, the difference we're talking about here is still somewhat small, but it is there. It likely reflects an overall trend for male players that if I had enough data and could make a category for each age, would pan out.

Average Race Representation
Blood ElfDraeneiDwarfGnomeGoblinHumanNight ElfOrc TaurenTroll UndeadWorgen
Y12.32%6.44%5.31%3.86%5.8%14.41%9.98%9.1%8.53%8.21%9.18%6.84%
O13.51%7.37%5.66%5.05%6.28%14.46%8.25%8.19%8.73%6.82%8.39%7.3%
D1.190.930.351.190.480.05-1.73-0.910.2-1.39-0.790.46

From this (crammed) chart, we can see that the blood elves, draenei, dwarves, gnomes, goblins, humans, tauren, and wrogen all increased in representation while the night elves, orcs, trolls, and undead decreased in representation.

Races Representation by Faction
Young46.84%53.16%
Older48.09%51.91%

And from this we can definitely confirm something the previous table hints at, which is that the Alliance is more popular among older players than younger players. Oddly, the Blood Elves had the most significant gain when going from younger to older respondents (tied w/ gnomes). This is very interesting given the Horde's overall decrease in popularity. Similarly, the Night Elves saw a dramatic loss in representation despite the Alliance's overall increase in popularity. Frankly, I find this odd and I'm somewhat at a loss as to why this may be. Are young men afraid of playing the less muscular blood elf? Does the night elf suddenly become "not cool" as men age? I certainly welcome guesses/perspective in the comments.

From the results presented above we can see that the age of a player (at least for male players) has an influence on how they pick and choose their characters. I unfortunately did not have enough data to do a similar study comparing different age groups of female respondents, but I hope to be able to do so in the future.

I plan on coming back to this sort of age comparison in a later post, when I talk about for which races and classes men like to play female characters. Men play far more female characters than women do male characters and we'll be looking at where they tend to do so the most.

          - Σ Δ

Monday, February 13, 2012

WoW Survey Results: Gender and Class

Last time we covered the differences in race selection by the gender of the respondents. This time, we're going to talk about the differences in class selection by the gender of the respondents. There are tons of ways to break this down, so let's get started.

Breakdown by class

Classes played by male respondents
PaladinDruidWarriorDKShamanHunterPriestMageRogueWarlock
12.69%11.24%11.03%10.27%10.22%9.72%9.61%9.10%8.45%7.67%

Classes played by female respondents
DruidPriestHunterPaladinShamanMageDKWarlockRogueWarrior
15.71%13.60%12.48%11.22%10.66%9.96%7.15%7.01%6.31%5.89% 

The classes that increased in representation if you go from male to female respondents were: druid, shaman, hunter, priest, mage, and warlock. The classes that decreased in representation were, paladin, warrior, dk, and rogue.

One of the things that we want to do when we look at this is to figure out the trend. Certainly by looking at which classes decreased in popularity it would seem that women don't like being in melee as much as men do. Is that the chief difference? Or is it that women don't like wearing plate or rogues as much? I think this deserves some breakdowns.

Breakdown by roles available

Average class representation
Male respondents
No HealHeal
No Tank8.74%9.92%
Tank10.65%11.97%
Female respondents
No HealHeal
No Tank8.94%12.13%
Tank6.52%13.47%
 
But what does this all mean? Both male and female respondents seem to enjoy classes that can heal as opposed to classes that can't heal. There is a clear indication that male respondents would rather have the option of tanking than to not have the option. However, with the female respondents, we see an increase from dps/healing hybrid (top right) to 3-way hybrid (bottom right) but a decrease from pure DPS (top left) to tank/dps hybrid (bottom left).

If you think about it, the tank/dps hybrids are warriors and Death Knights. They are both plate classes. SO maybe this all has to do with the aesthetics of armor types and it cascades into the roles of the class. Let's look at some more breakdowns.

Breakdown by armor type

Average Class Representation
ClothLeatherMailPlate
Male8.79%9.85%9.97%11.33%
Female10.42%11.01%11.57%8.09% 

From this chart it would appear that male players prefer heavier armor types, with cloth being far below leather and mail and plate being far above. It's a bit more complicated for female players. We can certainly say that they don't play plate-wearing characters as often as the others, but otherwise there is an increasing trend from cloth up to mail.

So what is it? Is it that female players just don't like plate, but otherwise prefer heavier armor? Let's check something else out.

Breakdown by location in battle

Average Class Representation
MaleFemale
Melee9.92%6.45%
Mix8.54%9.40%
Ranged9.03%10.76%
From this chart, it would appear that women tend to prefer to prefer to stand at range as opposed to melee. Male players have a much more even distribution of preferences. But there may be something else at play here. Loot at the bottom four classes for the female respondents: Death Knight, warlock, rogue, and warrior. What separates them from the others? They have a different tone than the other classes. The Death Knight is dark, filled with necromantic energy. The warlock uses fel energy; it is literally demonic. The rogue is sneaky and ruthless. The warrior is often thought of as a barbarian. They have these harsh connotations to them. Maybe that's a source of their lack of representation.

Conclusion
I've just spent an awful large amount of time trying to figure out the motivations that give us the breakdown of classes played by the female respondents to my survey. This is because when we look at the breakdown by roles, their isn't a clear explanation. There was an increase from healer/dps hybrids to 3-way hybrids but a decrease from pure dps to tank/dps hybrids. 

When looking at the decrease I saw that something else may have been at play. Both tank/dps hybrids are plate classes! But the paladin is also a plate class and has a quite favorable representation among the female respondents. Paladins can heal, warriors and Death Knights cannot. This means paladins can be at range. What happens if we bring rogues into this? They're melee only and also feature a low representation. When looking at the numbers it would seem that melee versus range seems to play a big role in the class choice of the female respondents. Lastly, when we bring another data point into the analysis, the representation of the warlock, we appears to be the classes with darker themes that feature the lowest representation. But the warlock has been unpopular this expansion in general and is receiving an overhaul in Mists of Pandaria to make is more appealing, so maybe bringing it into this analysis isn't going to help.

The problem that's at the heart of this is correlation, and it can be a big problem in statistics. If you've ever taken a statistics class, you've likely heard talk about independent random variables. When things are independent (unrelated to one another) it's easier to isolate the effect of each variable. In our case, the classes with harsh connotations tend towards melee DPS. Both of those groups tend towards plate wearers. Those groups all tend towards the having the role of tanking available. There is a relationship in how the classes are designed that obfuscates the motivations at hand here. Furthermore, I didn't collect information about specs (for reasons of it being difficult to parse the data that I would receive. I'm going to talk about all of that in a much later post.), but I did collect something else. I asked each person what their feelings were about different activities in a PVE scenario.

Difference From The Average Score by Gender
TankingHealingRDPSMDPS
Male-0.14-0.170.30.01
Female-0.540.20.62-0.28
 
For that chart I had asked everyone to rate those activities on a scale from 1 to 5, with 5 meaning that you loved participating in that activity. I split my respondents by gender and found the average score for each activity and then I took the average of those averages and subtracted it from original averages. This would let me see which activities a gender liked "more than average" and "less than average". From this, we can see that male respondents liked ranged DPS more than average and melee DPS slightly more than average. Female respondents liked healing and ranged DPS more than average and tanking and melee DPS less than average.

So maybe that's it. Maybe the female respondents just typically don't like melee DPS and tanking as much as they do healing and ranged DPS. This effect would cascade down and affect what armor types the female respondents wear, and what classes they play. 

The only real way to get a handle on the motivations for why someone plays the classes they do is to ask. So, dear readers, what classes do you play and why do you play them? Of particular interest is if you made a conscious decision to switch from one class to another. 
 
Remember, statistics are a function of a group. They can't tell you anything about an individual. So no matter what a group does, you should never use that to suggest that a person do or not do something.

Thursday, February 9, 2012

WoW Survey Results: Gender and Race

Cats are magic
How do men and women play World of Warcraft? We've all heard talk about the differences between male and female WoW players. Some of that might reflect truth, some of that may reflect enforced gender roles. But has anyone just gone out there and asked them? [Editors Note: Yes, others have. No I won't link you. -HMP]

About a year ago, shortly before patch 4.1 was released, I made a survey and tried to distribute it among several sources, but the only place where it took off was MMO-Champion. In the survey I asked players about their age, gender, their characters, and what they liked to do when playing.

This data was collected during patch late patch 4.0, and consisted only of people who frequent MMO-Champion. As such, it's hard to apply everything here directly to our current WoW population. Absolute results should be assumed to likely not apply, but comparative results should still be quite relevant. For example, I won't talk about the ratio of male to female players or the age distributions of players in my results because I have a unique subset of the WoW playing population.

Race Choices
Player/CharacterHordeAlliance
Male51.21%48.78%
Female45.54%54.46%
 
From this table we can see that female respondents tend to play Alliance characters slightly more than male respondents do. This does not mean that the Alliance has more female players than male players. The only way to do that would be a comprehensive survey of WoW players or an in-game random sampling of players. I wouldn't trust asking people in-game, they'd probably be weirded out by someone whispering them and asking them their age and gender.

Races played by male players
HumanBlood ElfNight ElfTaurenUndeadOrcDraeneiTrollWorgenGoblinDwarfGnome
14.89%12.41%9.00%8.80%8.27%8.10%7.51%7.51%7.19%6.11%5.51%4.66%
Races played by female players
Blood ElfDraeneiNight ElfHumanWorgenTaurenTrollGoblinGnomeUndeadOrcDwarf
17.13%14.47%13.09%10.86%8.07%7.94%7.52%5.85%5.01%3.76%3.34%2.92%

Humans and elves are popular all around, but the popularity/percentage of play changes drastically depending upon the gender of the respondent. In the transition from male to female the human, undead, orc and dwarf representations drastically lowers while the draenei, blood elf, and night elf representations increase dramatically. If you consider the sexual dimorphism for each of the races and the comparative attractiveness between each race's genders it would appear that a large factor in this has to do with wanting one's character to be attractive/human. The more monstrous races tend toward the lower side of the scale, while the more attractive and human ones tend toward the higher side of the scale. In the case of the draenei, the males are large and strange, while their females are more human sized and proportioned. I can't really account for the loss of representation of humans in the transition except that their popularity may pale in comparison to the elves and the draenei.

It's important to remember that people play different races for a great variety of reasons and that the reasons listed above do not apply to everybody's decision. This merely reflects the overall trend. One reason to pick a race that actually went away quite a bit in Cataclysm was race/class combinations. They were far more restrictive prior to Cataclysm and were opened up significantly and now there are far fewer restrictions than there were.

In general, you find that the distribution of races is more even among the male players, while it is more skewed among the female players. I can't really account for what this means, though. Commenters are certainly welcome to speculate.

Next time the discussion will be about the gender of the player and the classes they play. That one is going to be a doozy.

Monday, February 6, 2012

20 Days of WoW Blogging: Day 12 - A day in the life

Going to work.
For me a weekday starts at 6:35 AM, which is when my alarm goes off. I'll lay in bed and read twitter so that I can wake up my brain without getting out of bed. The amount of time spent doing so is highly variable, and depends on how much everyone that I follow's insomnia was acting up. I'm generally out of bed somewhere between 6:50 and 7:00 AM. The first thing I do is shower. After showering, I brush my teeth and shave before I return to the bedroom to get dressed. Once I'm dressed and have everything I need, I'm out the door to work somewhere around 7:30.

Work is nearby so I'm generally there, upstairs, and at my desk in 10 minutes. First, I check my work email and begin another day. My work consists of pulling reports for people out of our databases as well as fulfilling certain daily, weekly, and monthly tasks. I spend a good amount of time waiting for SQL queries to run, which affords me time to do things such as check the internet and twitter.  I have a one hour lunch that I usually take at 11:00 and I leave work between 4:00 and 4:30, depending on when I arrived and if I really want to finish something before I leave that day.

Fred and George
When I get home I greet my cats and then I get to fully check my internet. There are many things that get blocked by our work filter that I can't check while I'm there. On some days, Sarah works until 8:00 so I'll spend that time writing blog posts and whatnot so I can spend time with her once she gets home. Throw in chores and dinner and TV watching and that's usually all I have time for in a day. I usually go to bed between 10:30 and 11:00.

I don't usually find time to play WoW on weekdays, but I'm finding more time to do so. In my free time I'll also do some statistics work for my upcoming blog posts. If I'm really in the mood, then I'll do some Java coding on various projects that I'm working on. I do spend most of my time relaxing.

Over the weekend, I try to get ahead of my blogging for the week, writing posts to be scheduled during the week. I'll also try to catch up on my WoW playing and my playing of other video games. Sometimes there will be other things on the internet that I'd previously failed to read, so I'll read those too. The weekend is mostly for relaxing. I finally get to sleep in, and that's wonderful.